中商官网
中商官网
 数据库
数据库

2014 Deep Research Report on Global and China Rubber Gloves Industry
2014 Deep Research Report on Global and China Rubber Gloves Industry
<2014 Deep Research Report on Global and China Rubber Gloves Industry> was professional and depth research report on Global and China Rubber Gloves industry. The report firstly introduced Rubber Gloves basic information included Rubber Gloves definition classification application industry chain structure industry overview; international market analysis, China domestic market analysis, Macroeconomic environment and economic situation analysis and influence, Rubber Gloves industry policy and plan, Rubber Gloves product specification, manufacturing process, product cost structure etc. then statistics Global and China key manufacturers Rubber Gloves capacity production cost price profit production value gross margin etc details information, at the same time, statistics these manufacturers Rubber Gloves products customers application capacity market position company contact information etc company related information, then collect all these manufacturers data and listed Global and China Rubber Gloves capacity production capacity market share production market share supply demand shortage import export consumption etc data statistics, and then introduced Global and China Rubber Gloves 2009-2019 capacity production price cost profit production value gross margin etc information. And also listed Rubber Gloves upstream raw materials equipments and down stream clients survey analysis and Rubber Gloves marketing channels industry development trend and proposals. In the end, The report introduced Rubber Gloves new project SWOT analysis Investment feasibility analysis investment return analysis and also give related research conclusions and development trend analysis on Global and China Rubber Gloves industry. In a word, it was a depth research report on Global and China Rubber Gloves industry. And thanks to the support and assistance from Rubber Gloves industry chain related technical experts and marketing engineers during Research Team survey and interviews.
【Report Name】:2014 Deep Research Report on Global and China Rubber Gloves Industry
【Published】:Sep/2014
【Report Code】:QY
【Report Pages】:191
【Report Charts】:230
【Form】: PDF or Hard copy
【Delivery】: E-mail or EMS
【Report Price】:Hard Copy: 2200 USD
PDF Copy (single user): 2200 USD
Global License: 4200 USD
【Telephone】:0755-25407713 Online QQ:1113842166
company WEB SITE ://www.askci.com
【Abstract】:
<2014 Deep Research Report on Global and China Rubber Gloves Industry> was professional and depth research report on Global and China Rubber Gloves industry. The report firstly introduced Rubber Gloves basic information included Rubber Gloves definition classification application industry chain structure industry overview; international market analysis, China domestic market analysis, Macroeconomic environment and economic situation analysis and influence, Rubber Gloves industry policy and plan, Rubber Gloves product specification, manufacturing process, product cost structure etc. then statistics Global and China key manufacturers Rubber Gloves capacity production cost price profit production value gross margin etc details information, at the same time, statistics these manufacturers Rubber Gloves products customers application capacity market position company contact information etc company related information, then collect all these manufacturers data and listed Global and China Rubber Gloves capacity production capacity market share production market share supply demand shortage import export consumption etc data statistics, and then introduced Global and China Rubber Gloves 2009-2019 capacity production price cost profit production value gross margin etc information. And also listed Rubber Gloves upstream raw materials equipments and down stream clients survey analysis and Rubber Gloves marketing channels industry development trend and proposals. In the end, The report introduced Rubber Gloves new project SWOT analysis Investment feasibility analysis investment return analysis and also give related research conclusions and development trend analysis on Global and China Rubber Gloves industry. In a word, it was a depth research report on Global and China Rubber Gloves industry. And thanks to the support and assistance from Rubber Gloves industry chain related technical experts and marketing engineers during Research Team survey and interviews.
Table of Contents
Chapter One Rubber Gloves Industry Overview 1
1.2 Rubber Gloves Classification and Application 1
1.3 Rubber Gloves Industry Chain Structure 3
1.4 Rubber Gloves Industry Overview 3
Chapter Two Rubber Gloves International and China Market Analysis 4
2.1 Rubber Gloves Industry International Market Analysis 4
2.1.1 Rubber Gloves International Market Development History 4
2.1.2 Rubber Gloves Product and Technology Developments 5
2.1.3 Rubber Gloves Competitive Landscape Analysis 6
2.1.4 Rubber Gloves International Key Countries Development Status 7
2.1.5 Rubber Gloves International Market Development Trend 7
2.2 Rubber Gloves Industry China Market Analysis 8
2.2.1 Rubber Gloves China Market Development History 8
2.2.2 Rubber Gloves Product and Technology Developments 8
2.2.3 Rubber Gloves Competitive Landscape Analysis 10
2.2.4 Rubber Gloves China Key Regions Development Status 10
2.2.5 Rubber Gloves China Market Development Trend 11
2.3 Rubber Gloves International and China Market Comparison Analysis 11
Chapter Three Rubber Gloves Industry Development Environmental Analysis 12
3.1 China Economic Environment Analysis 12
3.1.1 China GDP Analysis 12
3.1.2 China CPI Analysis 13
3.2 European Economic Environmental Analysis 15
3.3 United States Economic Environmental Analysis 16
3.4 Japan Economic Environmental Analysis 17
3.5 Global Economic Environmental Analysis 17
Chapter Four Rubber Gloves Development Policy and Plan 19
4.1 Rubber Gloves Industry Policy Analysis 19
4.2 Rubber Gloves Industry News Analysis 24
4.3 Rubber Gloves Industry Development Trend 29
Chapter Five Rubber Gloves Manufacturing Process and Cost Structure 29
5.1 Rubber Gloves Product Specifications 29
5.2 Rubber Gloves Manufacturing Process Analysis 32
5.3 Rubber Gloves Cost Structure Analysis 33
5.4 Rubber Gloves Price Cost Gross Analysis 33
Chapter Six 2009-2014 Rubber Gloves Productions Supply Sales Demand Market Status and Forecast 34
6.1 2009-2014 Rubber Gloves Capacity Production (Million Pieces) Overview 34
6.2 2009-2014 Rubber Gloves Production Market Share Analysis 41
6.3 2009-2014 Rubber Gloves Demand Overview 45
6.4 2009-2014 Rubber Gloves Supply Demand and Shortage 47
6.5 2009-2014 Rubber Gloves Import Export Consumption 48
6.6 2009-2014 Rubber Gloves Cost Price Production Value Gross Margin 48
Chapter Seven Rubber Gloves Key Manufacturers Analysis 49
7.1 Top Glove 49
7.1.1 Company Profile 49
7.1.2 Product Picture and Specification 50
7.1.3 Capacity Production Price Cost Production Value 52
7.1.4 Contact Information 54
7.2 Kossan Rubber 54
7.2.1 Company Profile 54
7.2.2 Product Picture and Specification 55
7.2.3 Capacity Production Price Cost Production Value 56
7.2.4 Contact Information 58
7.3 SUPERMAX 59
7.3.1 Company Profile 59
7.3.2 Product Picture and Specification 60
7.3.3 Capacity Production Price Cost Production Value 61
7.3.4 Contact Information 63
7.4 Hartalega 63
7.4.1 Company Profile 63
7.4.2 Product Picture and Specification 64
7.4.3 Capacity Production Price Cost Production Value 65
7.4.4 Contact Information 66
7.5 Sempermed 66
7.5.1 Company Profile 66
7.5.2 Product Picture and Specification 67
7.5.3 Capacity Production Price Cost Production Value 68
7.5.4 Contact Information 70
7.6 YTY GROUP 70
7.6.1 Company Profile 70
7.6.2 Product Picture and Specification 70
7.6.3 Capacity Production Price Cost Production Value 71
7.6.4 Contact Information 73
7.7 Tan Sin Lian Industries 73
7.7.1 Company Profile 73
7.7.2 Product Picture and Specification 75
7.7.3 Capacity Production Price Cost Production Value 75
7.7.4 Contact Information 77
7.8 Riverstone 77
7.8.1 Company Profile 77
7.8.2 Product Picture and Specification 78
7.8.3 Capacity Production Price Cost Production Value 78
7.8.4 Contact Information 80
7.9 Titilatex 80
7.9.1 Company Profile 80
7.9.2 Product Picture and Specification 81
7.9.3 Capacity Production Price Cost Production Value 81
7.9.4 Contact Information 83
7.10 Brightway Group 83
7.10.1 Company Profile 83
7.10.2 Product Picture and Specification 84
7.10.3 Capacity Production Price Cost Production Value 85
7.10.4 Contact Information 86
7.11 RUBBERCARE 86
7.11.1 Company Profile 86
7.11.2 Product Picture and Specification 87
7.11.3 Capacity Production Price Cost Production Value 88
7.11.4 Contact Information 89
7.12 Concept Rubber Products 90
7.12.1 Company Profile 90
7.12.2 Product Picture and Specification 91
7.12.3 Capacity Production Price Cost Production Value 92
7.12.4 Contact Information 93
7.13 Ansell 93
7.13.1 Company Profile 93
7.13.2 Product Picture and Specification 95
7.13.3 Capacity Production Price Cost Production Value 95
7.13.4 Contact Information 96
7.14 Medicom 97
7.14.1 Company Profile 97
7.14.2 Product Picture and Specification 97
7.14.3 Capacity Production Price Cost Production Value 98
7.14.4 Contact Information 100
7.15 AMMEX 100
7.15.1 Company Profile 100
7.15.2 Product Picture and Specification 101
7.15.3 Capacity Production Price Cost Production Value 102
7.15.4 Contact Information 103
7.16 Shandong Yuyuan 103
7.16.1 Company Profile 103
7.16.2 Product Picture and Specification 104
7.16.3 Capacity Production Price Cost Production Value 105
7.16.4 Contact Information 107
7.17 Zhangjiagang Dayu 107
7.17.1 Company Profile 107
7.17.2 Product Picture and Specification 108
7.17.3 Capacity Production Price Cost Production Value 108
7.17.4 Contact Information 110
7.18 Shandong Xingyu 110
7.18.1 Company Profile 110
7.18.2 Product Picture and Specification 112
7.18.3 Capacity Production Price Cost Production Value 112
7.18.4 Contact Information 114
7.19 Zheniiang Suhui 114
7.19.1 Company Profile 114
7.19.2 Product Picture and Specification 114
7.19.3 Capacity Production Price Cost Production Value 115
7.19.4 Contact Information 117
7.20 Zhanjiang Jiali 117
7.20.1 Company Profile 117
7.20.2 Product Picture and Specification 118
7.20.3 Capacity Production Price Cost Production Value 118
7.20.4 Contact Information 120
7.21 Anhui Haojie 120
7.21.1 Company Profile 120
7.21.2 Product Picture and Specification 121
7.21.3 Capacity Production Price Cost Production Value 122
7.21.4 Contact Information 124
7.22 Suzhou colour-way 124
7.22.1 Company Profile 124
7.22.2 Product Picture and Specification 125
7.22.3 Capacity Production Price Cost Production Value 125
7.22.4 Contact Information 127
7.23 SHANDONG DENGSHENG 127
7.23.1 Company Profile 127
7.23.2 Product Picture and Specification 128
7.23.3 Capacity Production Price Cost Production Value 129
7.23.4 Contact Information 130
7.24 Zhangjiagang Hongyu 130
7.24.18 Company Profile 130
7.24.19 Product Picture and Specification 131
7.24.20 Capacity Production Price Cost Production Value 131
7.24.21 Contact Information 133
7.25 Zhangjiagang Xinda 133
7.25.1 Company Profile 133
7.25.2 Product Picture and Specification 134
7.25.3 Capacity Production Price Cost Production Value 134
7.25.4 Contact Information 136
7.26 Beijing Huateng 136
7.26.1 Company Profile 136
7.26.2 Product Picture and Specification 137
7.26.3 Capacity Production Price Cost Production Value 138
7.26.4 Contact Information 140
7.27 Sihui HongFu 140
7.27.1 Company Profile 140
7.27.2 Product Picture and Specification 141
7.27.3 Capacity Production Price Cost Production Value 141
7.27.4 Contact Information 143
7.28 SHANGHAI KEBANG 143
7.28.1 Company Profile 143
7.28.2 Product Picture and Specification 144
7.28.3 Capacity Production Price Cost Production Value 144
7.28.4 Contact Information 146
Chapter Eight Up and Down Stream Industry Analysis 147
8.1 Rubber Gloves Upstream Raw Materials Price Analysis 147
8.2 Rubber Gloves Upstream Equipments Market Analysis 149
8.3 Down Stream Demand Analysis 150
8.4 Industry Chain Analysis 151
Chapter Nine Rubber Gloves Marketing Channels Analysis 152
9.1 Rubber Gloves Marketing Channels Status 152
9.2 Rubber Gloves Marketing Channels Characteristic 152
9.3 Rubber Gloves Marketing Channels Development Trend 153
Chapter Ten Rubber Gloves Industry Development Trend 155
10.1 2014-2019 Rubber Gloves Capacity Production Overview 155
10.2 2014-2019 Rubber Gloves Production Market Share Analysis 158
10.3 2014-2019 Rubber Gloves Demand Overview 162
10.4 2014-2019 Rubber Gloves Supply Demand and Shortage 163
10.5 2014-2019 Rubber Gloves Import Export Consumption 163
10.6 2014-2019 Rubber Gloves Cost Price Production Value Gross Margin 164
Chapter Eleven Rubber Gloves Industry Development Proposals 165
11.1 Macroeconomic Development Countermeasures 165
11.2 New Firms Enter Market Strategy 168
11.3 New Project Investment Proposals 170
11.4 Marketing Channel Strategy Proposals 171
11.5 Competitive Environment Strategy Proposals 172
Chapter Twelve Rubber Gloves New Project Investment Feasibility Analysis 173
12.1 Rubber Gloves Project SWOT Analysis 173
12.2 Rubber Gloves New Project Investment Feasibility Analysis 174
12.2.1 Project Name 174
12.2.2 Investment budget 174
Chapter Thirteen Global and China Rubber Gloves Industry Research 176
Tables and Figures
Figure Rubber Gloves 1
Figure Rubber Gloves Industry Chain 3
Figure Rubber Gloves Competitive Landscape 6
Figure Rubber Gloves International Key Countries Production Status 7
Figure Rubber Gloves International Market Development Trend 7
Figure Rubber Gloves China Market Development History 8
Figure Rubber Gloves Product and Technology 8
Figure Rubber Gloves Competitive Landscape 10
Figure Rubber Gloves China Key Regions Development Status 10
Figure Rubber Gloves China Market Development Trend 11
Figure Rubber Gloves International and China Market Comparison 11
Figure 2005-2013 China GDP and Growth Rate 12
Figure 2005-2013 China CPI Change Trend 13
Figure 2005-2013 China PMI Change Trend 13
Figure 2005-2012 Financial Revenue (Billion yuan) and Growth 14
Figure Total Fixed Asset Investment (Billion yuan) 14
Figure 2005-2013 European GDP Growth Rate 15
Figure 2006-2013 European CPI Change Trend 15
Figure 2005-2013 United States GDP Change Trend 16
Figure 2006-2013 United States CPI Change Trend 16
Figure 2005-2013 Japan GDP Change Trend 17
Figure 2006-2013 Japan CPI Change Trend 17
Table import duty & taxes and import restrictions for Rubber Gloves 19
Figure Rubber Gloves Industry Development Trend 29
Figure TOP Glove Latex Glove Product Specification 29
Figure TOP Glove Nitrile Glove Product Specification 30
Figure TOP Glove Vinyl Gloves Product Specification 30
Figure TOP Glove Surgical Glove Product Specification 31
Figure TOP Glove Household Gloves Product Specification 31
Figure TOP Glove High Risk Gloves Product Specification 31
Figure Manufacturing Process of Rubber Gloves 32
Figure Rubber Gloves Cost Structure 33
Figure Rubber Gloves Price Cost Gross Analysis 33
Table 2009-2014 Global Major Manufacturers Rubber Gloves Capacity and total Capacity (Million Pieces) List 34
Table 2009-2014 Global Major Manufacturers Rubber Gloves Production and Total Production (Million Pieces) List 35
Table 2009-2014 Global Major Manufacturers Rubber Gloves Production Value (Million USD) and Total Production Value List 36
Figure 2009-2014 Global Rubber Gloves Capacity Production (Million Pieces) and Growth Rate 37
Table 2009-2014 Global Rubber Gloves Capacity Utilization Rate List 38
Figure 2009-2014 Global Rubber Gloves Capacity Utilization Rate 38
Table 2009-2014 China Major Manufacturers Rubber Gloves Capacity and Total Capacity (Million Pieces) List 38
Table 2009-2014 China Major Manufacturers Rubber Gloves Production and Total Production (Million Pieces) List 39
Table 2009-2014 China Major Manufacturers Rubber Gloves Production Value (Million USD) and Total Production Value List 39
Figure 2009-2014 China Rubber Gloves Capacity Production (Million Pieces) and Growth Rate 40
Table 2009-2014 China Rubber Gloves Capacity Utilization Rate List 40
Figure 2009-2014 China Rubber Gloves Capacity Utilization Rate 41
Table 2009-2014 Global Major Manufacturers Rubber Gloves Capacity Market Share List 41
Table 2009-2014 Global Major Manufacturers Rubber Gloves Production Market Share List 42
Table 2009-2014 Global Major Manufacturers Rubber Gloves Production Value Market Share List 43
Table 2009-2014 China Major Manufacturers Rubber Gloves Capacity Market Share List 44
Table 2009-2014 China Major Manufacturers Rubber Gloves Production Market Share List 44
Table 2009-2014 China Major Manufacturers Rubber Gloves Production Value Market Share List 45
Table 2009-2014 Global Rubber Gloves Demand (Million Pieces) List 45
Figure 2009-2014 Global Rubber Gloves Demand (Million Pieces) and Growth Rate 46
Table 2009-2014 China Rubber Gloves Consumption (Million Pieces) List 46
Figure 2009-2014 China Rubber Gloves Consumption (Million Pieces) and Growth Rate 47
Table 2009-2014 Global Rubber Gloves Demand Supply Shortage (Million Pieces) List 47
Table 2009-2014 China Rubber Gloves Consumption Supply Shortage (Million Pieces) List 47
Table 2009-2014 China Rubber Gloves Import Export Consumption (Million Pieces) 48
Table 2009-2014 Global Rubber Gloves Capacity Production (Million Pieces) Price Cost Gross (USD/K Pieces) Production Value (Million USD) Gross Margin List 48
Table 2009-2014 China Rubber Gloves Capacity Production (Million Pieces) Price Cost Gross (USD/K Pieces) Production Value (Million USD) Gross Margin List 49
Figure Top Glove Rubber Gloves Product Picture 50
Table Top Glove Rubber Gloves Specification 51
Figure Top Glove Rubber Gloves Product Picture 51
Table Top Glove Rubber Gloves Specification 52
Table 2009-2014 Top Glove Rubber Gloves Capacity Production (Million pcs) Price Cost Gross ($/K pcs) Production Value (Million $) Gross Margin List 52
Figure 2009-2014 Top Glove Rubber Gloves Capacity Production (Million pcs) and Growth Rate 53
Figure 2009-2014 Top Glove Rubber Gloves Production Global Market Share 53
Figure Kossan Rubber Rubber Gloves Product Picture 55
Table Kossan Rubber Rubber Gloves Specification 56
Table 2009-2014 Kossan Rubber Rubber Gloves Capacity Production (Million pcs) Price Cost Gross ($/K pcs) Production Value (Million $) Gross Margin List 56
Figure 2009-2014 Kossan Rubber Rubber Gloves Capacity Production (Million pcs) and Growth Rate 57
Figure 2009-2014 Kossan Rubber Rubber Gloves Production Global Market Share 58
Figure SUPERMAX Rubber Gloves Product Picture 60
Table SUPERMAX Rubber Gloves Specification 61
Table 2009-2014 SUPERMAX Rubber Gloves Capacity Production (Million pcs) Price Cost Gross ($/K pcs) Production Value (Million $) Gross Margin List 61
Figure 2009-2014 SUPERMAX Rubber Gloves Capacity Production (Million pcs) and Growth Rate 62
Figure 2009-2014 SUPERMAX Rubber Gloves Production Global Market Share 62
Figure Hartalega Rubber Gloves Product Picture 64
Table Hartalega Rubber Gloves Specification 64
Table 2009-2014 Hartalega Rubber Gloves Capacity Production (Million pcs) Price Cost Gross ($/K pcs) Production Value (Million $) Gross Margin List 65
Figure 2009-2014 Hartalega Rubber Gloves Capacity Production (Million pcs) and Growth Rate 65
Figure 2009-2014 Hartalega Rubber Gloves Production Global Market Share 66
Figure Sempermed Rubber Gloves Product Picture 67
Table Sempermed Rubber Gloves Specification 68
Table 2009-2014 Sempermed Rubber Gloves Capacity Production (Million pcs) Price Cost Gross ($/K pcs) Production Value (Million $) Gross Margin List 68
Figure 2009-2014 Sempermed Rubber Gloves Capacity Production (Million pcs) and Growth Rate 69
Figure 2009-2014 Sempermed Rubber Gloves Production Global Market Share 69
Figure YTY GROUP Rubber Gloves Product Picture 70
Table YTY GROUP Rubber Gloves Specification 71
Table 2009-2014 YTY GROUP Rubber Gloves Capacity Production (Million pcs) Price Cost Gross ($/K pcs) Production Value (Million $) Gross Margin List 71
Figure 2009-2014 YTY GROUP Rubber Gloves Capacity Production (Million pcs) and Growth Rate 72
Figure 2009-2014 YTY GROUP Rubber Gloves Production Global Market Share 72
Figure Tan Sin Lian Industries Rubber Gloves Product Picture 75
Table Tan Sin Lian Industries Rubber Gloves Specification 75
Table 2009-2014 Tan Sin Lian Industries Rubber Gloves Capacity Production (Million pcs) Price Cost Gross ($/K pcs) Production Value (Million $) Gross Margin List 75
Figure 2009-2014 Tan Sin Lian Industries Rubber Gloves Capacity Production (Million pcs) and Growth Rate 76
Figure 2009-2014 Tan Sin Lian Industries Rubber Gloves Production Global Market Share 76
Figure Riverstone Rubber Gloves Product Picture 78
Table Riverstone Rubber Gloves Specification 78
Table 2009-2014 Riverstone Rubber Gloves Capacity Production (Million pcs) Price Cost Gross ($/K pcs) Production Value (Million $) Gross Margin List 78
Figure 2009-2014 Riverstone Rubber Gloves Capacity Production (Million pcs) and Growth Rate 79
Figure 2009-2014 Riverstone Rubber Gloves Production Global Market Share 79
Figure Titilatex Rubber Gloves Product Picture 81
Table Titilatex Rubber Gloves Specification 81
Table 2009-2014 Titilatex Rubber Gloves Capacity Production (Million pcs) Price Cost Gross ($/K pcs) Production Value (Million $) Gross Margin List 81
Figure 2009-2014 Titilatex Rubber Gloves Capacity Production (Million pcs) and Growth Rate 82
Figure 2009-2014 Titilatex Rubber Gloves Production Global Market Share 83
Figure Brightway Group Rubber Gloves Product Picture 84
Table Brightway Group Rubber Gloves Specification 84
Table 2009-2014 Brightway Group Rubber Gloves Capacity Production (Million pcs) Price Cost Gross ($/K pcs) Production Value (Million $) Gross Margin List 85
Figure 2009-2014 Brightway Group Rubber Gloves Capacity Production (Million pcs) and Growth Rate 85
Figure 2009-2014 Brightway Group Rubber Gloves Production Global Market Share 86
Figure RUBBERCARE Rubber Gloves Product Picture 87
Table 2009-2014 RUBBERCARE Rubber Gloves Capacity Production (Million pcs) Price Cost Gross ($/K pcs) Production Value (Million $) Gross Margin List 88
Figure 2009-2014 RUBBERCARE Rubber Gloves Capacity Production (Million pcs) and Growth Rate 88
Figure 2009-2014 RUBBERCARE Rubber Gloves Production Global Market Share 89
Figure Concept Rubber Products Rubber Gloves Product Picture 91
Table Concept Rubber Products Rubber Gloves Specification 91
Table 2009-2014 Concept Rubber Products Rubber Gloves Capacity Production (Million pcs) Price Cost Gross ($/K pcs) Production Value (Million $) Gross Margin List 92
Figure 2009-2014 Concept Rubber Products Rubber Gloves Capacity Production (Million pcs) and Growth Rate 92
Figure 2009-2014 Concept Rubber Products Rubber Gloves Production Global Market Share 93
Figure Ansell Rubber Gloves Product Picture 95
Table Ansell Rubber Gloves Specification 95
Table 2009-2014 Ansell Rubber Gloves Capacity Production (Million pcs) Price Cost Gross ($/K pcs) Production Value (Million $) Gross Margin List 95
Figure 2009-2014 Ansell Rubber Gloves Capacity Production (Million pcs) and Growth Rate 96
Figure 2009-2014 Ansell Rubber Gloves Production Global Market Share 96
Figure Medicom Rubber Gloves Product Picture 97
Table Medicom Rubber Gloves Specification 98
Table 2009-2014 Medicom Rubber Gloves Capacity Production (Million pcs) Price Cost Gross ($/K pcs) Production Value (Million $) Gross Margin List 98
Figure 2009-2014 Medicom Rubber Gloves Capacity Production (Million pcs) and Growth Rate 99
Figure 2009-2014 Medicom Rubber Gloves Production Global Market Share 99
Figure AMMEX Rubber Gloves Product Picture 101
Table AMMEX Rubber Gloves Specification 101
Table 2009-2014 AMMEX Rubber Gloves Capacity Production (Million pcs) Price Cost Gross ($/K pcs) Production Value (Million $) Gross Margin List 102
Figure 2009-2014 AMMEX Rubber Gloves Capacity Production (Million pcs) and Growth Rate 102
Figure 2009-2014 AMMEX Rubber Gloves Production Global Market Share 103
Figure Shandong Yuyuan Rubber Gloves Product Picture 104
Table Shandong Yuyuan Rubber Gloves Specification 105
Table 2009-2014 Shandong Yuyuan Rubber Gloves Capacity Production (Million pcs) Price Cost Gross ($/K pcs) Production Value (Million $) Gross Margin List 105
Figure 2009-2014 Shandong Yuyuan Rubber Gloves Capacity Production (Million pcs) and Growth Rate 106
Figure 2009-2014 Shandong Yuyuan Rubber Gloves Production Global Market Share 106
Figure Zhangjiagang Dayu Rubber Gloves Product Picture 108
Table 2009-2014 Zhangjiagang Dayu Rubber Gloves Capacity Production (Million pcs) Price Cost Gross ($/K pcs) Production Value (Million $) Gross Margin List 108
Figure 2009-2014 Zhangjiagang Dayu Rubber Gloves Capacity Production (Million pcs) and Growth Rate 109
Figure 2009-2014 Zhangjiagang Dayu Rubber Gloves Production Global Market Share 110
Figure Shandong Xingyu Rubber Gloves Product Picture 112
Table Shandong Xingyu Rubber Gloves Specification 112
Table 2009-2014 Shandong Xingyu Rubber Gloves Capacity Production (Million pcs) Price Cost Gross ($/K pcs) Production Value (Million $) Gross Margin List 112
Figure 2009-2014 Shandong Xingyu Rubber Gloves Capacity Production (Million pcs) and Growth Rate 113
Figure 2009-2014 Shandong Xingyu Rubber Gloves Production Global Market Share 113
Figure Zheniiang Suhui Rubber Gloves Product Picture 114
Table Zheniiang Suhui Rubber Gloves Specification 115
Table 2009-2014 Zheniiang Suhui Rubber Gloves Capacity Production (Million pcs) Price Cost Gross ($/K pcs) Production Value (Million $) Gross Margin List 115
Figure 2009-2014 Zheniiang Suhui Rubber Gloves Capacity Production (Million pcs) and Growth Rate 116
Figure 2009-2014 Zheniiang Suhui Rubber Gloves Production Global Market Share 116
Figure Zhanjiang Jiali Rubber Gloves Product Picture 118
Table Zhanjiang Jiali Rubber Gloves Specification 118
Table 2009-2014 Zhanjiang Jiali Rubber Gloves Capacity Production (Million pcs) Price Cost Gross ($/K pcs) Production Value (Million $) Gross Margin List 118
Figure 2009-2014 Zhanjiang Jiali Rubber Gloves Capacity Production (Million pcs) and Growth Rate 119
Figure 2009-2014 Zhanjiang Jiali Rubber Gloves Production Global Market Share 119
Figure Anhui Haojie Rubber Gloves Product Picture 121
Table Anhui Haojie Rubber Gloves Specification 122
Table 2009-2014 Anhui Haojie Rubber Gloves Capacity Production (Million pcs) Price Cost Gross ($/K pcs) Production Value (Million $) Gross Margin List 122
Figure 2009-2014 Anhui Haojie Rubber Gloves Capacity Production (Million pcs) and Growth Rate 123
Figure 2009-2014 Anhui Haojie Rubber Gloves Production Global Market Share 123
Figure Suzhou colour-way Rubber Gloves Product Picture 125
Table Suzhou colour-way Rubber Gloves Specification 125
Table 2009-2014 Suzhou colour-way Rubber Gloves Capacity Production (Million pcs) Price Cost Gross ($/K pcs) Production Value (Million $) Gross Margin List 125
Figure 2009-2014 Suzhou colour-way Rubber Gloves Capacity Production (Million pcs) and Growth Rate 126
Figure 2009-2014 Suzhou colour-way Rubber Gloves Production Global Market Share 127
Figure SHANDONG DENGSHENG Rubber Gloves Product Picture 128
Table 2009-2014 SHANDONG DENGSHENG Rubber Gloves Capacity Production (Million pcs) Price Cost Gross ($/K pcs) Production Value (Million $) Gross Margin List 129
Figure 2009-2014 SHANDONG DENGSHENG Rubber Gloves Capacity Production (Million pcs) and Growth Rate 129
Figure 2009-2014 SHANDONG DENGSHENG Rubber Gloves Production Global Market Share 130
Figure Zhangjiagang Hongyu Rubber Gloves Product Picture 131
Table 2009-2014 Zhangjiagang Hongyu Rubber Gloves Capacity Production (Million pcs) Price Cost Gross ($/K pcs) Production Value (Million $) Gross Margin List 131
Figure 2009-2014 Zhangjiagang Hongyu Rubber Gloves Capacity Production (Million pcs) and Growth Rate 132
Figure 2009-2014 Zhangjiagang Hongyu Rubber Gloves Production Global Market Share 133
Figure Zhangjiagang Xinda Rubber Gloves Product Picture 134
Table 2009-2014 Zhangjiagang Xinda Rubber Gloves Capacity Production (Million pcs) Price Cost Gross ($/K pcs) Production Value (Million $) Gross Margin List 134
Figure 2009-2014 Zhangjiagang Xinda Rubber Gloves Capacity Production (Million pcs) and Growth Rate 135
Figure 2009-2014 Zhangjiagang Xinda Rubber Gloves Production Global Market Share 135
Figure Beijing Huateng Rubber Gloves Product Picture 137
Table 2009-2014 Beijing Huateng Rubber Gloves Capacity Production (Million pcs) Price Cost Gross ($/K pcs) Production Value (Million $) Gross Margin List 138
Figure 2009-2014 Beijing Huateng Rubber Gloves Capacity Production (Million pcs) and Growth Rate 139
Figure 2009-2014 Beijing Huateng Rubber Gloves Production Global Market Share 139
Figure Sihui HongFu Rubber Gloves Product Picture 141
Table 2009-2014 Sihui HongFu Rubber Gloves Capacity Production (Million pcs) Price Cost Gross ($/K pcs) Production Value (Million $) Gross Margin List 141
Figure 2009-2014 Sihui HongFu Rubber Gloves Capacity Production (Million pcs) and Growth Rate 142
Figure 2009-2014 Sihui HongFu Rubber Gloves Production Global Market Share 142
Figure SHANGHAI KEBANG Rubber Gloves Product Picture 144
Table SHANGHAI KEBANG Rubber Gloves Specification 144
Table 2009-2014 SHANGHAI KEBANG Rubber Gloves Capacity Production (Million pcs) Price Cost Gross ($/K pcs) Production Value (Million $) Gross Margin List 144
Figure 2009-2014 SHANGHAI KEBANG Rubber Gloves Capacity Production (Million pcs) and Growth Rate 145
Figure 2009-2014 SHANGHAI KEBANG Rubber Gloves Production Global Market Share 146
Figure Global Natural Rubber Production By Country 147
Figure natural and synthetic rubber Price 147
Figure Natural Rubber in Rubber Consumption (%) 148
Figure Natural Rubber Production 149
Figure Latex gloves linkage line 149
Table Latex gloves linkage line 149
Figure Natural Rubber Gloves and Synthetic Rubber Gloves Market Share in 2013 150
Figure Rubber Gloves market 151
Figure Rubber Gloves Marketing Channels Status 152
Figure 2014-2019 Global Rubber Gloves Capacity Production (Million Pieces) and Growth Rate 155
Figure 2014-2019 Global Rubber Gloves Capacity Utilization Rate 156
Figure 2014-2019 China Rubber Gloves Capacity Production (Million Pieces) and Growth Rate 156
Figure 2014-2019 China Rubber Gloves Capacity Utilization Rate 157
Figure 2014 Global Rubber Gloves Production Market Share 158
Figure 2019 Global Rubber Gloves Production Market Share 159
Figure 2014 China Rubber Gloves Production Market Share 160
Figure 2019 China Rubber Gloves Production Market Share 161
Figure 2014-2019 Global Rubber Gloves Demand (Million Pieces) and Growth Rate 162
Figure 2014-2019 China Rubber Gloves Demand (Million Pieces) and Growth Rate 162
Table 2009-2014 Global Rubber Gloves Demand Supply Shortage (Million Pieces) List 163
Table 2009-2014 China Rubber Gloves Demand Supply Shortage (Million Pieces) List 163
Table 2014-2019 China Rubber Gloves Import Export Consumption (Million Pieces) 163
Table 2014-2019 Global Rubber Gloves Capacity Production (Million Pieces) Price Cost Gross (USD/K Pieces) Production Value (Million USD) Gross Margin List 164
Table 2014-2019 China Rubber Gloves Capacity Production (Million Pieces) Price Cost Gross (USD/K Pieces) Production Value (Million USD) Gross Margin List 164
Table Macroeconomic Development Countermeasures Analysis 165
Table Rubber Gloves New Firms Enter Market Strategy 168
Table Rubber Gloves New Project Investment Proposals 170
Table Rubber Gloves Marketing Channel Strategy Proposals 171
Table Rubber Gloves Competitive Environment Strategy Proposals 171
Figure Rubber Gloves marketing strategy recommendations 172
Table Total Investment of the Project 174
Figure main technical and economic data 175
Figure 2009-2014 Rubber Gloves Price Trend 176
Figure 2009-2014 China Rubber Gloves Proportion in the World Change 177
Figure 2009-2014 Rubber Gloves Demand List 177
本报告所有内容受法律保护,中华人民共和国涉外调查许可证:国统涉外证字第1454号。 本报告由中商产业研究院出品,报告版权归中商产业研究院所有。本报告是中商产业研究院的研究与统计成果,报告为有偿提供给购买报告的客户内部使用。未获得中商产业研究院书面授权,任何网站或媒体不得转载或引用,否则中商产业研究院有权依法追究其法律责任。如需订阅研究报告,请直接联系本网站,以便获得全程优质完善服务。 本报告目录与内容系中商产业研究院原创,未经本公司事先书面许可,拒绝任何方式复制、转载。 在此,我们诚意向您推荐鉴别咨询公司实力的主要方法。
2024年5月14日,宜宾市经济和信息局在宜宾主持召开了《宜宾光伏产业高质量发展规划》(以下简称《规划》)...
2024年5月14日,宜宾市经济和信息局在宜宾主持召开了《宜宾光伏产业高质量发展规划》(以下简称《规划》)...
查看详情
5月8日,贵阳市观山湖区2024年“观图学苑”招商专题开放课堂暨观山湖区干部“强省会”能力素质提升专题讲座...
5月8日,贵阳市观山湖区2024年“观图学苑”招商专题开放课堂暨观山湖区干部“强省会”能力素质提升专题讲座...
查看详情
4月25日,湖南省东安县委副书记、县长蒋华一行莅临我院考察交流,会上蒋县长对我院编制的《东安县热能综合...
4月25日,湖南省东安县委副书记、县长蒋华一行莅临我院考察交流,会上蒋县长对我院编制的《东安县热能综合...
查看详情
4月23日,中共毕节委组织部、毕节市投资促进局在毕节市委党校举办全市产业大招商专题培训会。培训会上,中...
4月23日,中共毕节委组织部、毕节市投资促进局在毕节市委党校举办全市产业大招商专题培训会。培训会上,中...
查看详情
4月15日,新疆维吾尔自治区哈密市人民政府党组成员、副市长一行李建勇莅临我院考察指导,会上李市长介绍了...
4月15日,新疆维吾尔自治区哈密市人民政府党组成员、副市长一行李建勇莅临我院考察指导,会上李市长介绍了...
查看详情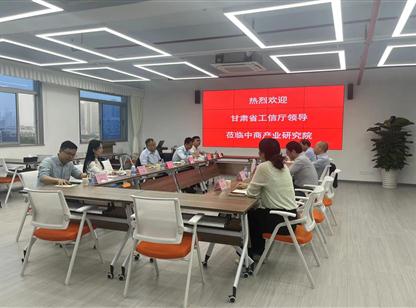
4月9日,甘肃省工业和信息化厅副厅长王永庆一行莅临我院考察指导,会上王厅长介绍了甘肃省的产业基础及现状...
4月9日,甘肃省工业和信息化厅副厅长王永庆一行莅临我院考察指导,会上王厅长介绍了甘肃省的产业基础及现状...
查看详情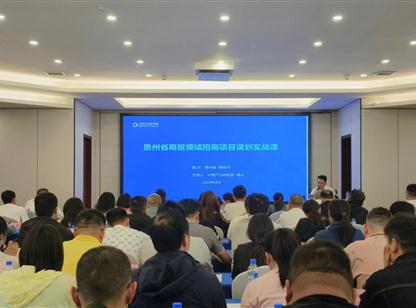
4月2日至3日,贵州省商务厅在贵阳市举办2024年全省商务系统项目专题培训会。培训会上,中商情报网联合创始...
4月2日至3日,贵州省商务厅在贵阳市举办2024年全省商务系统项目专题培训会。培训会上,中商情报网联合创始...
查看详情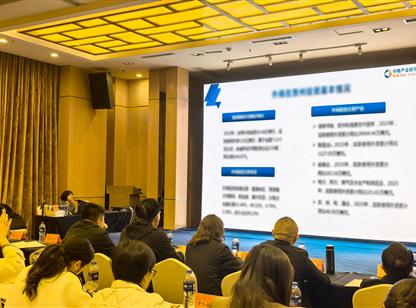
3月19日,贵州省商务厅组织召开《2024 年贵州省外资工作会暨外商投资业务培训会》。培训会上,我院项目老师...
3月19日,贵州省商务厅组织召开《2024 年贵州省外资工作会暨外商投资业务培训会》。培训会上,我院项目老师...
查看详情